Say that a fifth grade student needs help to solve the following problem. What would you do?
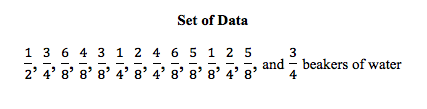
“Use the following set of data to create a line plot that shows the amount of water contained in identical beakers. Find the total amount of water held in the beakers that are less than half full. Each beaker holds 100 mL of water.”
Help me!
First you need to understand that line plots are just basically number lines and students have already worked with them since the first or second grade. The long set of data? It is just a group of numbers that need to be placed on the number line to create a graph.
Then you need to find out the Common Core Standard Code that covers line plots, which in this case is 5.MD.B.2. The “5” stands for the fifth grade and the “MD.B.2” stands for the Section and Standard Number (Measurement and Data Standard No. 2). These Standard Codes can be found on most Common Core resources websites, including: http://www.corestandards.org/Math/
Once you know the Standard Code, go to the products section of my webpage and find 5.MD.B.2 – Line Plots. This will link you to my lesson plans.
5.MD.B.2 Lesson Plan One (free online!)
Because common sense tells us not to teach the most difficult problem at the beginning, my first 5.MD.B.2 lesson plan starts by explaining what a line plot is using whole numbers. As I said before, line plots are just basically number lines and students have already worked with them since the first or second grades.
In my first example, we will create a line plot based on data collected from a group of students about the number of children in their families.
Say that ten students surveyed have the following number of children in their families.
3, 4, 2, 2, 1, 2, 5, 4, 1 and 2 children.
We will create a number line starting at 1 and ending at 5 to represent the least and most number of children in the ten families. Next, we will mark the line with an “X” to stand for each number in the above set of data. The final line plot that we will create will look as follows:
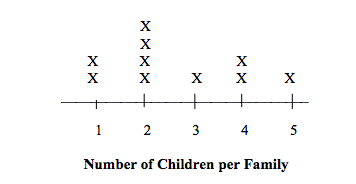
The lesson plan then asks questions about the line plot. For example:
“How many students have four children in their families?”
By looking at the line plot, it can be seen that two students have four children in their families. We can see this because we have marked two X’s above the number four.
Ok, maybe this isn’t quite as difficult as I initially thought but I am still not sure…
My next lesson plan describes step-by-step methods that can be used to easily divide a number line into fractions. All equivalent fractions will be labeled on the number line as it is divided.
Then we will graph a much smaller group of numbers to make sure that students are comfortable with line plots using fractions. The following is a sample problem from this second lesson plan.
“A teacher poured water into a set of 6 identical beakers. Beakers are glass containers that are typically used in a science experiment. The beakers were filled to the following levels:”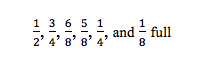
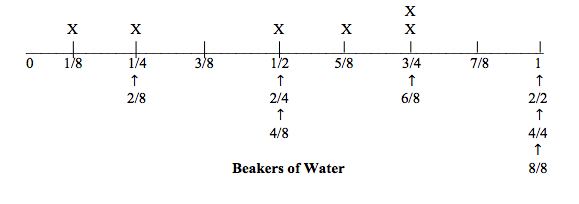
The line plot that we will create with this data will look as follows:
Students have the opportunity to perform a science experiment as part of this lesson plan. The science experiment has been designed to reinforce all of the concepts learned.
This might help my student remember that 3/4 and 6/8 are equivalent fractions because they are located in the same place on the number line!
Once students have mastered the skills of creating line plots using whole numbers and fractions, they will have the confidence to move on to solving more difficult problems. Remember the original question?
“Use the following set of data to create a line plot that shows the amount of water contained in identical beakers. Find the total amount of water held in the beakers that are less than half full. Each beaker holds 100 mL of water.”
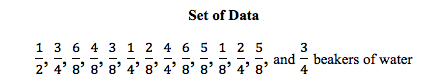
After completing the first two lesson plans, students will be able to create the following line plot:

Finally, we are ready to find the total amount of water in the beakers that are less than half full. By looking at the line plot we can see that four beakers are less than half full.
We will add these four fractions together using the common denominator of eighths.
1/8 + 2/8 + 2/8 + 3/8 = 8/8 full. This is equivalent to one full beaker or 100 mL of water.